Categories
Beats Elasticsearch ELK Filebeat Heartbeat Kibana Logstash Metricbeat Packetbeat Winlogbeat X-Pack

Elastic.On{2017}

This was my first Elastic.On conference and I really enjoyed it. Not everything was perfect, so let’s get a few minor “gripes” out of the way first:

  • Some of the sessions that included customer stories were in a Q&A format with the questions being led by an Elastic interviewer. These sessions seemed all a bit contrived to me with very much a “sales” focus. Probably not the right type of session for a cynic like me to attend – I hoped to hear a bit more detail and less “Elastic are great!” or “Look how clever we are”.
  • Sound quality in the larger rooms was very variable – you had to choose where to sit very carefully. Stage B was particularly poor in some locations despite many speakers around the room.
  • Smaller session venues were difficult to hear in as the background noise from the open areas and the large venues tended to “drown out” the speakers in those venues.
  • Restroom capacity was insufficient at times with long queues.
  • 2.4 Ghz Wifi coverage was poor – it only seemed to be available in Stage B.
  • Someone massively underestimated the number of buses required to get everyone to the party at the California Academy of Science.

The positives:

  • The Android app for the conference provided great information. Kudos to the team that did that.
  • The food and drink was plentiful and of great quality. The food trucks were exceptional in both general quality and the range of options available. The Maine Lobster roll I had on one day was quite exceptional.
  • Speaker quality was overall extremely good – only one session did I leave early due to the speaker being quite poor – and that was only one factor in my decision to leave the session as the subject turned out to be not quite what I had hoped.
  • Due to the international nature of the people involved, English was not always the speaker’s first language but in all cases their English and diction was extremely good.
  • All the technical sessions I attended were very good and the upcoming features were really interesting. The whole stack is progressing and maturing rapidly.
  • The Elastic guys were all very approachable, helpful and nice to talk to. The customers I met also had some interesting use-cases to share and I certainly discovered a whole new range of applications for the stack.

So overall, would I go again? Most definitely yes! This is a great set of products developed by what looks to be a great team of talented people. I suspect they will need a bigger venue next year though …


Categories
Elasticsearch Kibana SQL Server

Reducing SQL Server logspace usage

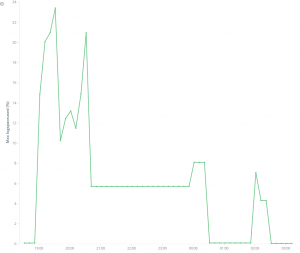
Further to my post on using Elasticsearch and Kibana to visualize SQL Server logspace usage, it turned out that this data allowed me to suggest an alternative scheduling time for a large update job (to span a log backup point).

As a result of this we should be able to reduce peak logspace usage from 25% of allocated space to around 20% – thus allowing the log file to be reduced in size dramatically.

Categories
Elasticsearch ELK Events Kibana Logstash nx-log

Elasticon 2017

I will be attending Elasticon 2017 in San Francisco in March.

Looking forward to it.

Categories
Elasticsearch ELK Kibana Peoplesoft Perl SQL Server

Visualizing SQL Server Logspace Usage with Elasticsearch, Kibana and Perl

There are many ways possible ways to collect logspace usage data from SQL Server – this was a quick way using the tools I had at hand – DBCC, perl, elastic search and kibana.

All I did was capture the output of:

DBCC SQLPERF(logspace)

into a temporary table using a simple perl script using DBI. I then did a SELECT against the temporary table in the same perl script and posted the resulting data into ES using the Search::Elasticsearch CPAN module. The ES index was very simple – just 4 columns: database, logspace, logspaceused (%) and the timestamp of the capture (GETDATE()).

After that, all I had to do was visualize the data using Kibana. Here’s some sample output:


logspaceused graph
Logspace (%) usage over time

A great way to see the log space pressure points which can easily be tied back to specific batch processes at those times.

Categories
Configuration Elasticsearch ELK Hints and Tips Peoplesoft VirtualBox

DPK VirtualBox Memory Allocation

Even though my laptop has a decent 12 Gb of RAM, I still like to minimise the RAM allocated to PeopleSoft VMs.

My experience is that the sweet spot is 3072 Mb for VMs without SES – I never bother with the beast that is SES. After all it is a dead application – Elasticsearch cannot arrive soon enough for me. You can get away with 2560 Mb of RAM but you will see some swapping in OEL – not good even if you have a fast SSD. Mine is “ok” – a Samsung 1 TB 850 EVO but allowing any swapping still makes the system slow down considerably.

Categories
Big Data Elasticsearch ELK Java Javascript Kibana Languages Logstash nx-log Ruby

ELK and PeopleSoft

I have spent some time looking into Elasticsearch, Logstash and Kibana (ELK) for analysis of PeopleSoft web, application and process scheduler log files.

Whilst commercial solutions exist that can be configured to do this, they all seem somewhat over priced solutions to a relatively common and essentially simple problem – log file shipping, consolidation/aggregation and analysis. This is where ELK steps in …. bringing a mix of Java, Ruby and Javascript to the party.

IMHO, ELK runs best on flavours of Unix – Linux, FreeBSD or even Solaris. I have also found the most effective solution for servers running Windows is to ship the logs with some simple pre-processing to a number of logstash processes on Linux using NXLog running as a service under Windows. This reduces the CPU load on the Windows servers so they can get on with their primary functions. Check out NXLog Community Edition for more details.

Determining the parsing rules for the various log file formats is probably the most difficult part. Provided you are reasonably familiar with both the data and regular expression matching, you should have no problem understanding and transforming your data into a format that is easy to visualise in Kibana.

However, when you hit any significant data volumes you really need to look carefully at the system settings for each component. Elasticsearch scales very well, but performs best when given plenty of memory.

Here’s a simple example from an nxlog.conf file on Windows:

1
2
3
4
5
6
7
8
9
10
11
12
13
14
15
16
17
18
19
20
21
22
Module im_file
#SavePos FALSE
#ReadFromLast FALSE
File 'I:\LOGS\PROD\APPSRV_*.LOG'
InputType multiline
Exec convert_fields("AUTO","utf-8");
Exec $filename = file_basename(file_name());
Exec $filedir = file_dirname(file_name());
Exec if $raw_event =~ /(GetCertificate|_dflt|Token authentication succeeded|PSJNI:|GetNextNumberWithGaps|RunAe|Switching to new log file|PublishSubscribe|Token=)/ { drop();};
Exec if $filedir =~ /\\(appserv|appserv\\prcs)\\([A-Z0-9\-]+)\\LOGS/ { $stack = $1; $server_name = $2; $server_ip = $3; $domain = $5;};
Exec $server_ip =~ s/_/./g;
Exec $host = $server_ip;
Exec if $raw_event =~ /([A-Za-z0-9\-_]+)@(\d+\.\d+\.\d+\.\d+)/ { $oprid = $1; $client_ip = $2;};
Exec if $raw_event =~ /^([A-Za-z_0-9]+)\.(\d+) \((\d+)\) \[(\d{2}.\d{2}.\d{2} \d{2}:\d{2}:\d{2})/ { $server_process = $1; $pid = $2; $task_no = $3; $datestamp = $4; };
Exec delete($EventReceivedTime); 
Exec delete($filedir); 
Exec delete($filename); 
Exec delete($SourceModuleType);
Exec $message = $raw_event;
Exec $message =~ s/^.*?\]//;
Exec $message =~ s/^\(\d+\)\s+//;
Exec to_json();

This is just an example that shows some reasonable nx-log directives to pre-process the PeopleSoft Application Server logs into a consistent and usable format. Some of the regular expressions are specific to my use case but they are useful to illustrate some simple techniques you may find useful.