Categories
Peoplesoft PeopleTools Performance SQL Server Tools Tuning Utilities

_WA_Sys Stats or Hand Crafted?

SQL Server generates histogram statistics automatically whenever a column is referenced in a predicate and it is not already the leading column in an existing histogram statistic. By design, indexes create histogram statistics automatically so any column you have that is the leading column in an index will already have histogram statistics.

The autogenerated statistics are prefixed _WA_Sys_ followed by:

  • the column name (in older SQL Server versions) or the column number in hex (for SQL Server 2008 onwards) e.g. EMPLID or 00000001
  • the object_id of the table in hex e.g. 57490C28

separated by an underscore. So auto-generated statistics look like this:

  • _WA_Sys_DESCR_57490C28 or _WA_Sys_00000013_57490C28

The issue for me as a PeopleSoft Administrator/DBA is whether I should keep these statistics or recreate them as “user” statistics with more sensible names. Oddly enough the “old style” naming convention which included the column name was actually better than the “hex” version we have now. After all what is column 00000014 (decimal 20) in table X?

My personal preference is to process the system generated statistics and recreate them as statistic “column name” on table X. I have a perl script that generates the relevant DROP/CREATE STATISTICS commands for an entire PeopleSoft database. The output looks like this:

--- Remove statistic _WA_Sys_AUDITRECNAME_5921A398 for column AUDITRECNAME on table PSRECDEFN
 
DROP STATISTICS [dbo].[PSRECDEFN].[_WA_Sys_AUDITRECNAME_5921A398];
 
--- Create User Statistic for column AUDITRECNAME (+ 1 keys) on table PSRECDEFN
 
CREATE STATISTICS [AUDITRECNAME] ON [dbo].[PSRECDEFN] ([AUDITRECNAME],[RECNAME]) WITH FULLSCAN;

Why do I like to do this? Well there are a number of reasons:

  1. The naming convention is clearer to me – open the statistics tree within a table in object explorer and you get a list of column names plus the statistics created for any indexes.
  2. Once I have changed to “user” statistics I can query for any new _WA_Sys_ statistics (yes I leave auto-generate switched on). This shows me any “new” query activity that accesses via previously unused predicate columns. This can help in deciding if perhaps new indexes are required.
  3. I can ensure the existing statistic are recreated using a “WITH FULLSCAN” not just sampled data. For many PeopleSoft systems this is essential – data can often be very skewed and sampling can miss this on occasion.
  4. I like to add in the “key” columns of the table to the histogram to provide better density information for the optimizer.  This can be essential information when intermediate key fields have a single value e.g. EMPL_RCD in HR is typically 0 in most cases.

If you would like to discuss this in more detail, leave a comment.
Categories
HRMS Peoplesoft Performance SQL Tuning

HOLIDAY_SCHEDULE SQL

If you come across this as one of your top (if not THE top) SQLs in your HR system:

SELECT HOLIDAY_SCHEDULE, HOLIDAY, 
(CONVERT(CHAR(10),HOLIDAY,121)), DESCR 
 FROM PS_HOLIDAY_DATE 
WHERE HOLIDAY_SCHEDULE=@P1 
  AND HOLIDAY=@P2 
ORDER BY HOLIDAY_SCHEDULE, HOLIDAY

then look no further than the ABSW_WRK page which is a hidden page on most absence related components. There is a scroll showing the holiday dates. Unfortunately, some developer decided to put a related display in the grid, resulting in “n” executes of the above SQL – where “n” is the number of rows you have in PS_HOLIDAY_DATE for the given employees’s HOLIDAY_SCHEDULE.

In the case I came across there were some 200+ rows in the table and as a result after just 3 working days the above SQL had been executed 21 million times. This actually makes this more frequent than the PSVERSION check!

Personally, I’d remove the related display field from the scroll completely. It isn’t referenced nor visible so why take the overhead of 200+ SQL lookups?

Update: Further analysis revealed an issue with a cartesian product on a customized scroll based on the standard ABSW_WRK page. That was causing the majority of the 21 million lookups by filling the scroll with “n” times the 200+ rows in the holiday table. But my point is still very valid – why lookup something you never show the users? If you really need it – put it in the view used in the scroll so it comes “for free” with the population of the grid.

Categories
Peoplesoft PeopleTools Performance Tuning Upgrade

PT 8.51.25 SYS DB Sizing – NCHAR() vs NVARCHAR()

Some quick statistics from a PeopleTools 8.51.25 SYS database on SQL Server:

  • Unicode with CHAR (i.e. NCHAR fields)       – DB size 1166 MB
  • Unicode with VARCHAR (i.e. NVARCHAR fields) – DB size 363 MB

That is almost a 70% reduction. Probably not that surprising given the number of character fields, but what is more interesting is the significant improvement in performance due to the increased number of rows per page for many tables.

An extreme example of this can be seen in PSAUDIT – using NCHAR this is close to 1200 characters wide due to 15 NCHAR(65) KEYn columns. Typically, the vast majority of the KEYn columns are empty since it is relatively rare for audited tables to have more than 5 key fields. Using NVARCHAR I have seen an average row width of 150 characters – meaning that a page holds 6 times as many rows on average.

Note: A value of 4 in the DATABASE_OPTIONS column of PSSTATUS will enable VARCHARs on SQL Server.

Categories
Hints and Tips Oracle SQL Server Tuning

Oracle vs SQL Server Terminology

Full Table Scan == Clustered Index Scan

In Oracle we are generally taught that a Full Table Scan is a bad thing. Whilst this isn’t always true (it depends on so many factors), the terminology used in Oracle makes it sound bad. With SQL server we have the concept of a Clustered Index (which is essentially just the table itself) but the equivalent terminology we see in the query plan is “Clustered Index Scan”. This sounds almost like a good thing to those from an Oracle background. But it isn’t. It’s a full table scan. 🙂

Categories
Peoplesoft PeopleTools SQL SQL Server Tuning

The hidden cost of CONVERT_IMPLICIT() …

There are numerous articles on the web about CONVERT_IMPLICIT() and how it can impact performance of queries in SQL Server. Recently I had cause to look at a SQL statement that referenced tables in two databases on the same SQL Server instance but running on different Peopletools releases. As one system is on PeopleTools 8.49 and the other is on 8.53, there is an underlying difference in how character table columns are created – 8.49 uses CHAR(), 8.53 uses NVARCHAR().

However, when you join tables from the 8.49 system to the 8.53 system on a character column such as EMPLID, SQL Server data type precedence rules will silently add a CONVERT_IMPLICIT() around the 8.49 CHAR() column to “upgrade it” to an NVARCHAR(). Therein lies a performance issue – with large tables on the 8.49 side we see significant spills to TempDB and even TempDB exhaustion in the worst case. Execution plans are adversely affected as a result of the loss of cardinality information as well.

The fix? CAST( … AS CHAR()) around the 8.53 column e.g.


1
WHERE CAST(A.EMPLID AS CHAR(11)) = B.EMPLID 

The moral of course of the story is always check your data types – especially if you are joining pre-8.5x and post-8.5x PeopleTools versions.

This is, of course, a generic issue. The Case for Specifying Data Types and Query Performance is an excellent article on the problems you might encounter using .Net or ORM database abstraction layers if you fail to specify your data types correctly.


Categories
Peoplesoft SQL Server Tuning

Trace Flag 4199 and PeopleSoft

Whilst I have a general rule not to use SQL Server trace flags unless I actually have the underlying issue, there is one exception:

Trace flag 4199

It switches on all the Query Optimizer (QO) fixes and saves you turning on the numerous individual QO fixes one by one. This trace flag is very well documented on the web (e.g. at Microsoft) and many people consider it essential for their systems. I do too.

One of the interesting comments in the above Microsoft article (last updated in 2012, but present in the article from the original in 2010) is the statement that future query optimizer fixes will not have individual trace flags of their own. So you are pretty much forced to use it in preference to individual trace flags going forwards.

PeopleSoft and TF 4199

In my experience, TF4199 is essential for PeopleSoft systems. Some of the early 2005/2008 fixes covered by TF 4199 are fundamental to good query execution plans in many areas of Peoplesoft. In particular, the fixes related to Fast Forward Read Only cursors are especially relevant as Peoplesoft makes extensive use of them.

Note: Trace flag 4199 is not a panacea for all your PeopleSoft performance problems – I have seen it slow down some SQL statements as well. But typically the affected statements were user queries that were badly designed in the first place 🙂

Categories
Peoplesoft Performance Tuning

SET ARITHABORT ON and PeopleSoft

My previous post focused on the specific issue of poor PS Query performance when ARITHABORT was set to OFF on the connection.

But the fix I suggested for that will also affect all other Peoplesoft connections. That means app servers, process schedulers, app engines, BI Publisher reports …pretty much every PS connection. But that really is what you want ….

So remember:

EXEC sys.sp_configure N'user options', N'64'
GO
RECONFIGURE WITH OVERRIDE
GO

is your friend 🙂

But remember to test it first …. 🙂

Categories
Peoplesoft SQL Server Tuning

Poor Query Performance under SQL Server (PeopleSoft)

Background

A PeopleSoft HRMS 8.8 system running on SQL Server 2008 R2 SP2 that is used as a reporting environment. Data is copied each night from production and a select but limited group of users run queries against it.

The system performance was both terrible and unpredictable. There was a “rule” in place that queries that ran for over two hours were cancelled. Two minutes seemed a long time for the data volumes involved to me.

Analysis

There were lots of things wrong with the instance setup such as default values for MAXDOP and “Cost threshold for Parallelism”, as well as only one TempDB file and unlimited RAM allocated to SQL server. Essentially, an out of the box SQL server install. Not even a Cumulative Update had been applied. In addition, SQL server had 128 GB of RAM and 16 Processors allocated to it so it was hardly short of resources.

But none of that, in itself, really explained the very poor performance of many of the user queries in PeopleSoft. Especially given that running the exact same query in SSMS gave completely different (and quite fast) results. The lack of indexing on the underlying tables and unnecessary cartesian products in the PeopleSoft query security views made the queries less than quick, but they still typically completed in a few seconds or minutes in SSMS. They often never finished in PS query either on-line or scheduled – even after 5 or 6 hours.

Now this database is a very old HRMS 8.8 system that has been upgraded from SQL Server 2000 and various old Peopletools releases up to the giddy heights of 8.49.28 🙂

After much investigation and running SQL Server Profiler along with Adam Machanic’s superb sp_WhoIsActive (read more about it from Brent Ozar here) it turned out to be all related to the setting of ARITHABORT – a well known but I think poorly understood issue.

There are numerous articles on the internet about the issues of SQL running faster in SSMS than via other clients. I leave you to search for those yourself, but to summarise:

You must make sure the connection settings you use in SSMS match those used by the application. Otherwise the query plan you see in SSMS may not bear any similarity to the one the application is using. This makes problem solving nearly impossible.

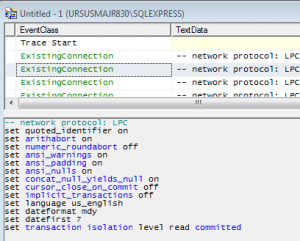
Profiler will help you identify the options set at the connection level:

ARITHABORT_SQLSERVER

And using:

EXEC sp_WhoIsActive @get_plans=1

will give you the session and the query plan which you can open and compare to the same plan in SSMS. If they are different you need to investigate why.

sp_WhoIsActive_Example

ARITHABORT

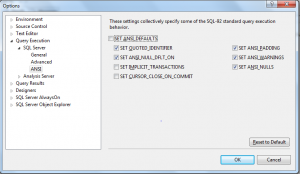
ARITHABORT is query plan affecting and a query plan “cache key” – so you will not get the same query plan in SSMS as the client application if the values are different. SQL server will have two plans for the same SQL statement. Remember as well that SSMS issues SET commands as defined in Tools -> Options -> SQL Server -> Query Execution:


SQLServerQueryExecutionOptions

ARITHABORT in PeopleSoft

Now the interesting thing about ARITHABORT is that the standard Peoplesoft install scripts create the Peoplesoft database and then issue two ALTER DATABASE commands:

ALTER DATABASE <DBNAME>
SET ARITHABORT ON
GO
ALTER DATABASE <DBNAME>
SET QUOTED_IDENTIFIER ON
GO

where <DBNAME> is your database name.

The install guide also tells you to ensure that QUOTED_IDENTIFIER ON is specified for any client connections to a Peoplesoft database. It goes on to explain that this can be set in the ODBC connection setup. What it fails to mention is setting ARITHABORT for client connections. This should also be set but you cannot set it on the ODBC connection. Best to set it at the INSTANCE connection level:

EXEC sys.sp_configure N'user options', N'64'
GO
RECONFIGURE WITH OVERRIDE
GO

Now assuming you have done that, and you have the default SSMS settings in place, the query execution plan you see for the PeopleSoft application via ODBC should match the one you get in SSMS. And, more importantly the plan that gets chosen will be a much better plan than with ARITHABORT OFF in a great many cases.

Now in this specific case it seems that someone created the original database without using the supplied script and so they did not set either of these default settings at the database. For QUOTED_IDENTIFER they did at least stick with the ODBC connection defaults so that was always ON. But sadly ARITHABORT was not.

The Fix

A quick ALTER database and a re-configure of SQL server, drop the Peoplesoft Application Servers and a SQL Server instance re-start and the problem was solved. It didn’t make every query faster but it did improve the vast majority. The ones it did not fix are typically the ones with missing joins 🙂 Now all I need to do is create some indexes that reflect the way the data is accessed and re-write the query security views to be more efficient and I should be able to get all the queries under two minutes. Well … those with joins between the tables … ….

NOTE: You could and perhaps **should** include QUOTED_IDENTIFER in that user options setting for extra safety (use 320 instead of 64 in the above sp_reconfigure). Just in case someone un-ticks that option whilst setting up ODBC.